The new release of JAWS Inspect adds some significant new tools to help different users with a wide range of testing scenarios.
Say-All
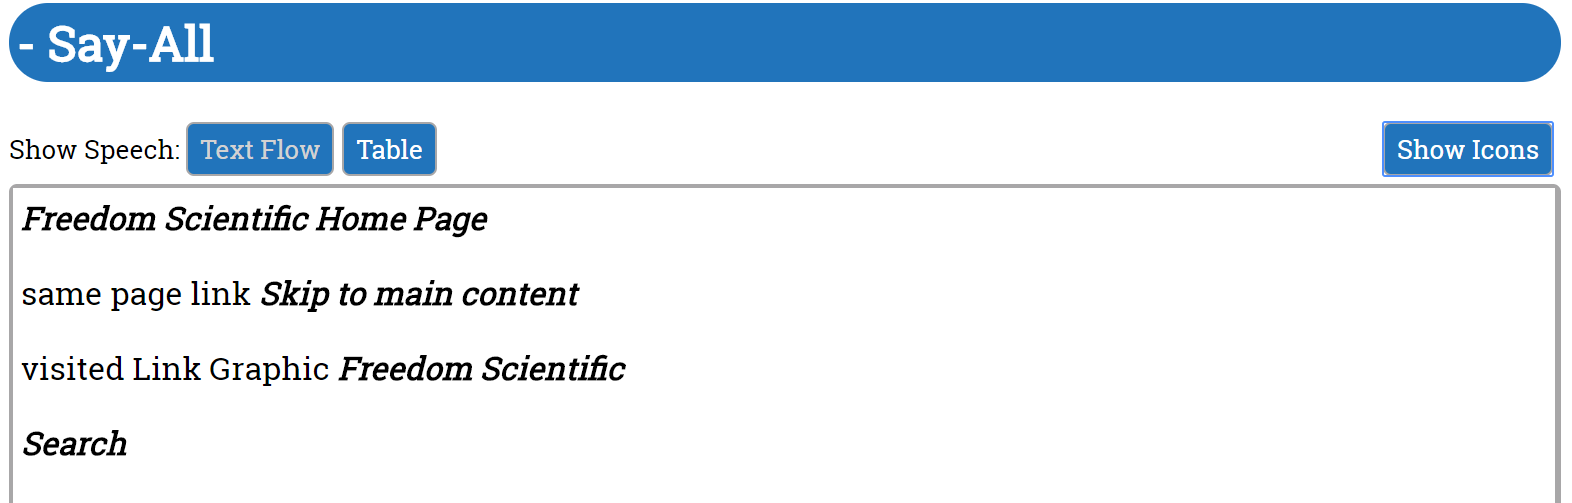
For those familiar with the Say All feature in JAWS, this new report essentially runs the Say All command on a web page and gives you back an easy-to-use, linear text version of the JAWS speech.
How Does it Help?
If you are testing your page with JAWS, you need to listen to all of the page contents first, and then go back if you want to double check something. It’s a slow process, especially if you’re not a JAWS user.
With JI you can generate a report with one click and then analyse it properly without the distraction of JAWS audio. Identify issues and quickly export them as bugs. Easily compare the JAWS speech with the page content.
How is it done?
Just open the JAWS Inspect menu (CTRL+ RIGHT CLICK) and select Say-All. A message will appear at the top of the screen when the report is processing. When it is ready, it will open in a new window in your default browser (default browser can be changed in JI settings).
Using Say-All
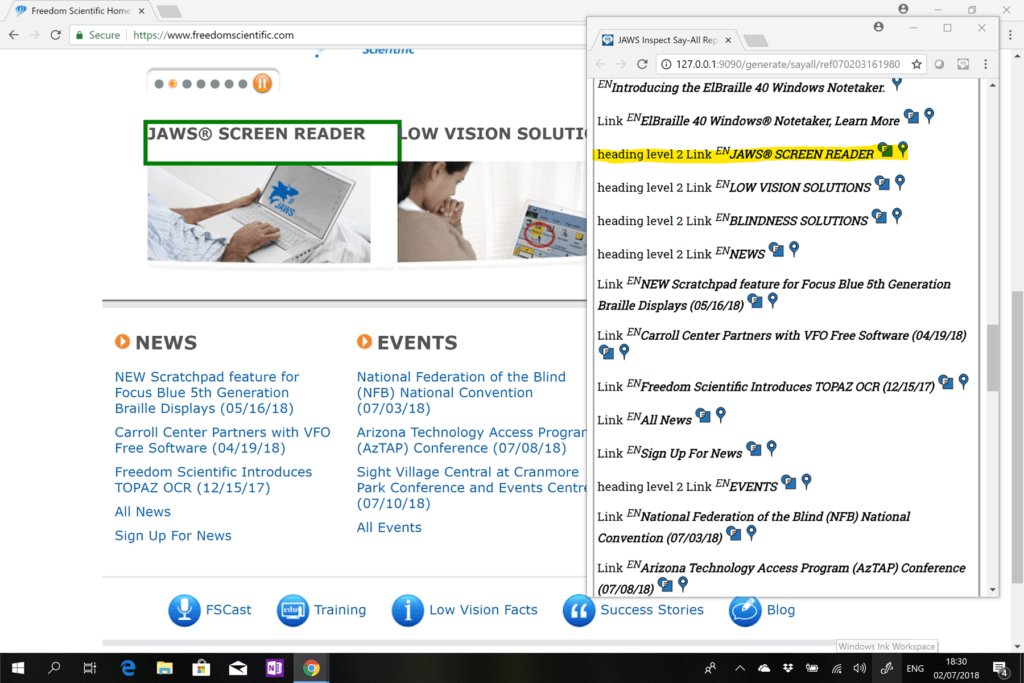
One way to use the report is to have it open in a window that sits over your web page and use the Spotlight feature to match the speech output with the content on the page. Just select the pin icon to display a highlight rectangle around the related page elements, similar to a browser inspect tool.
Speech Viewer
This is an entirely new type of tool for JAWS Inspect. Essentially a live log of JAWS speech, extending the range of JAWS Inspect beyond web sites to applications and even the desktop. Use it to test interactions, workflows or specific parts of a page, such as a form. You can also get JAWS output for desktop applications and PDF documents.
How Does it Help?
The other JI reports are snapshots of a page, or parts of a page. Ideal for static content or a piece-by-piece view of more interactive widgets. Speech Viewer is perfect for dynamic content and for logging interactions. For example, capture an online shopping flow (from adding an item to a cart to checking out and payment) and then export the JAWS speech for all of the steps. You can pause and restart as you go, logging just what you need.
How is it Done?
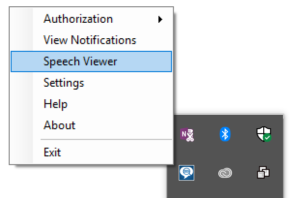
To open the Speech Viewer Right Click (SHIFT+F10) on the JAWS Inspect tray icon to open the JAWS Inspect menu. From the menu, select ‘Speech Viewer’. Once open it is ready to start logging. Just go back to the page or the application you want to test and begin the interaction.
For web pages, you can TAB through the page to jump to links or form fields or use the arrow keys to go item-by-item through all of the content. For more complex interaction, run JAWS at the same time (you can mute the audio). Now you can use all the JAWS keyboard commands.
Using the Speech Viewer
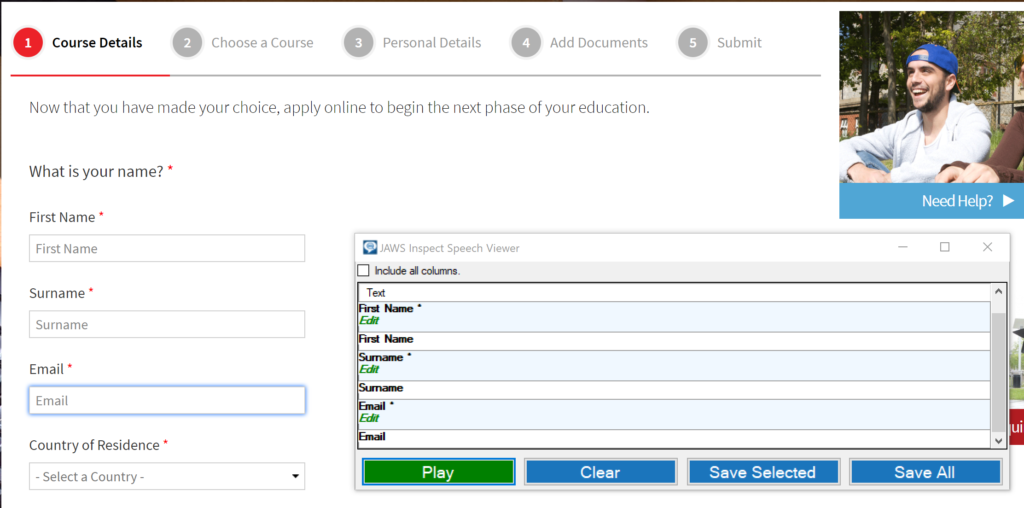
To capture a workflow, open the Speech Viewer and then start the process, letting the Viewer log as you go. In the example below place focus in the first form field when the Speech Viewer is open and then TAB between the fields to see the output. The main JAWS speech is formatted in Bold while additional JAWS speech (such as helper text) is in green italics.
When you’re done with the logging you can save the whole report, or select a row or a group of rows and export to CSV or copy to the clipboard.
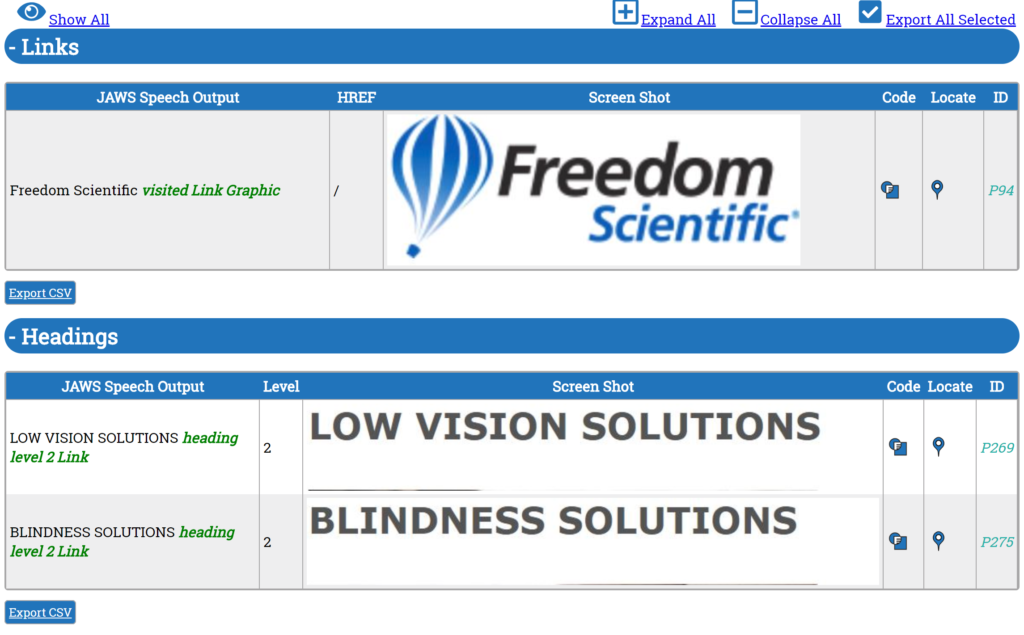
New Export Features
In addition to the new tools, this release includes some further enhancements to the Full Page Report. Now you can select all the items you want to share and export them all with one click. A big time saver when you want to raise bugs or alert team members to potential issues.

You can also choose to view only your selected items, so you have a customized report.
Wrapping Up
Since its launch in December 2017 JAWS Inspect has matured into a full suite of tools that can be used to check websites, run through workflows and analyse desktop applications and documents. Visit the JAWS Inspect page to learn more, or to arrange a demonstration.